
Analysis
The Court in Numbers
Quantitative analysis often reveals what is obscured by commentary and easily held opinions. Read on to know more about our work with data.

Writing the Supreme Court Observer’s Court Data posts used to fill me with dread. I didn’t have a natural proclivity for numbers, and I had only known the Court from its lengthy judgements and expositions on legal theory. Parsing through quantitative output felt to me like the work of economists and statisticians, not journalists and lawyers.
But the first Court Data story I worked on, almost exactly three years ago, opened up a different way to understand the institution. The post was a review of the number of judges across India’s High Courts. The numbers told a startling story about gender diversity on the bench. Out of the 650 sitting judges at the time, just 76 were women. Five High Courts did not have a single woman judge, and seven High Courts just had one. Numbers had buttressed the story of a male-dominated Court more starkly than words.
When we conducted the same study in June 2023, we found that a significant number of appointments had been made across the country. There were now 788 judges across High Courts. Yet, the percentage of women judges, as against the total number of judges, had increased by only 1.3 percent since 2021. Our yearly documentation had helped us realise just how slow progress had been.
While working with narrative and anecdote, it’s tempting to lapse into easy generalisations to make a forceful point. But data has helped us contextualise some of the widely held complaints against the Court.
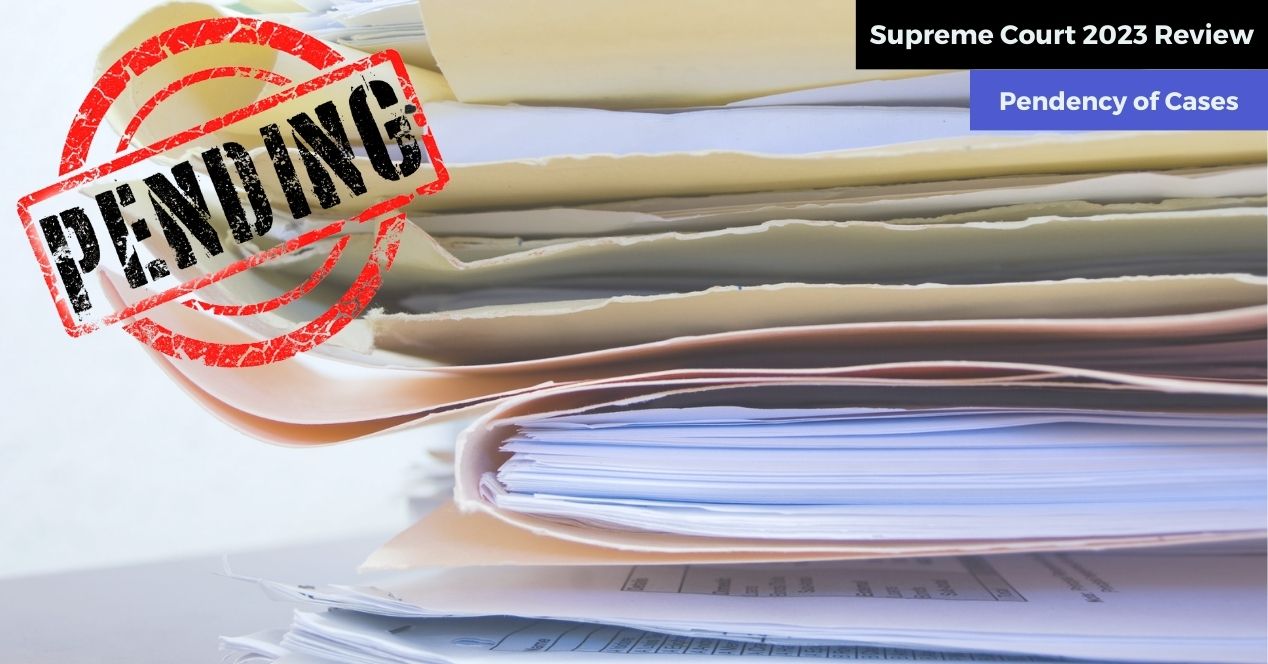
Take pendency, for instance. You would have come across many reports (including our own) about the Court’s mounting pending case pile, which crossed 80,000 in 2023. Vacancies and vacations are often attributed as causes for this burgeoning number. But we know that the Court has largely been functioning at full capacity for the past few years. Some quick number-crunching also helped us work out that the Indian Supreme Court’s 190 working days a year are a lot more compared to the US Supreme Court’s 68 days and the UK Supreme Court’s 149 days.
Last year may have ended with the highest pendency in a long time, but it was also the year that 53,770 cases were filed—a near 50 percent increase from 2022. The Court also managed to dispose of 52,220 cases in 2023. Now compare that with the Court’s disposal figures for the last two full years before the pandemic—37,470 in 2018 and 41,100 in 2019.
There’s another aspect to the pendency question—how many of those cases will be admitted by the Court and be heard on merits. We’ve recorded how, between 2016 and 2020, only 11 percent of cases filed were admitted. This suggests that a majority of filed cases do not concern an issue substantial enough to warrant the Court’s attention. It also helps us realise that thousands of frivolous cases are exacerbating the Court’s pendency crisis.
These are some of the ways in which data puts the institution in context, and makes our critique more robust and informed. Admittedly, the picture is often incomplete, not least because of the many gaps in institutional data collection, reporting, and even presentation. But we think of it like a puzzle, and there’s some fun to be had in putting the mosaic together.
So, do visit our Court Data page, and see our reviews of judges’ tenures in numbers, our monthly publications on pendency, institution and disposal, and much more. Some of those stories can help paint a more real picture of the Court, whatever that picture may be.
This article was first featured in SCO’s Weekly newsletter. Sign up now!
Related articles
Analysis
Pendency in the Supreme Court (2021)
Desk Brief: The total number of pending cases in the Supreme Court increased in 2021 for the fourth year in a row.

Court Data
Number of Pending Cases at the SC Begins to Offer Hope as 2022 Ends
The post-summer session of the Court saw pendency drop by almost 2,500 cases. Will this trend continue?
Court Data
Supreme Court makes a dent in pendency in 2023 despite closing with 80,439 open cases
The pendency number seems alarming but it needs to be viewed in the context of past figures, improved access and a change in counting method

Analysis
Supreme Court Review 2023: The diversity problem remained unaddressed
Even in a mostly full-strength Court, there was a startling lack of representation of religious minorities, women & marginalised communities